# How can we install subset of charts
### Is there a way to only install a subset of the charts
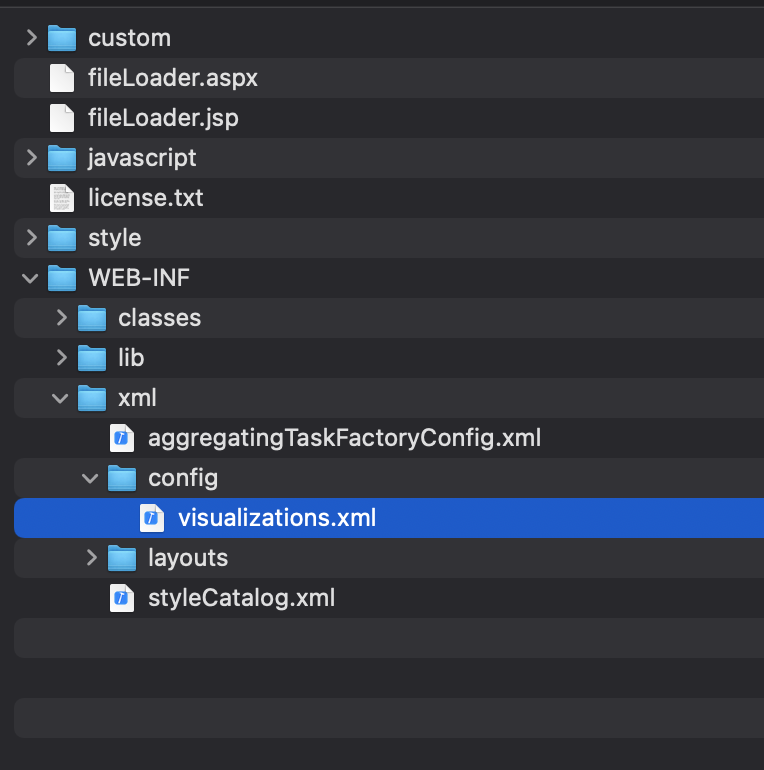
In order to make only a subset of the charts available to the users, one of the configuration (xml) files needs to be modified. Under the VitaraCharts folder (under MicroStrategy Web plugins folder), you will see the following set of folders and files. The specific file to be opened for editing is *VitaraCharts/WEB-INF/config/visualization.xml*
Please make a backup of this file before making any changes.
This file lists all the visuals that VitaraCharts includes. There are separate sections for each type of client (Web listed as ‘ajax’, ‘ipad’, ‘iphone’ etc) You can make changes under the ‘ajax’ visualization-list to restrict dossier authors from seeing all of the vitara plugins
Under this list, comment or remove specific visualizations that you don’t want to show your users. For instance, if you do not want to use the Vitara Bar chart, the highlighted section below should be commented or deleted.
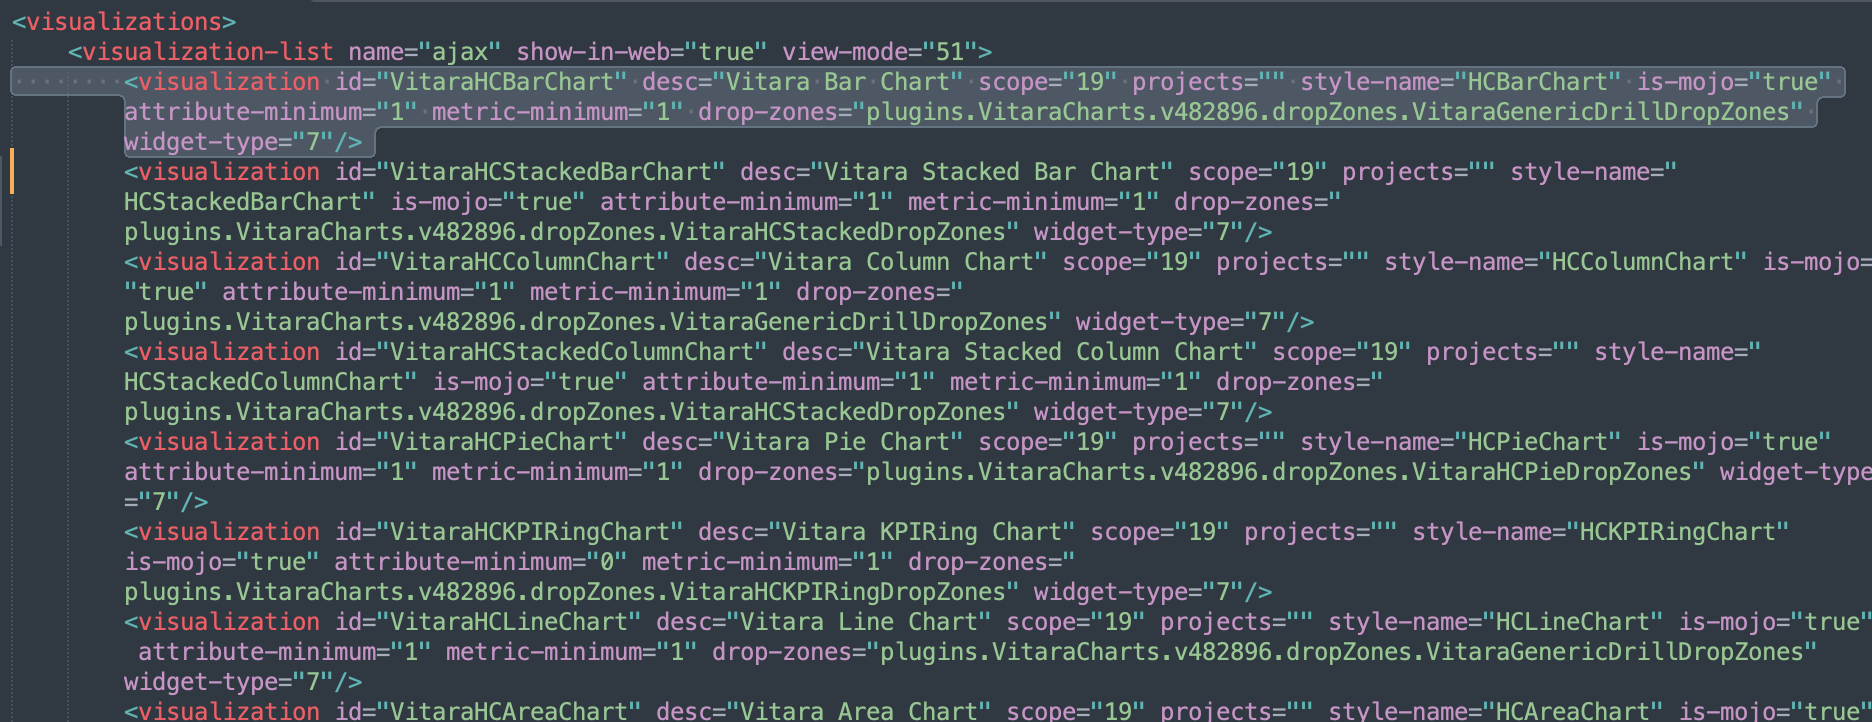
You do not need to make changes in any of the other sections (like ipad, iphone etc) because once the chart is removed from the ‘ajax’ section, it is not available to dossier authors. The other sections are only used for rendering the authored dossiers.
Once all changes are made, save the file and restart the web server. Please read through the error logs and make sure MicroStrategy did not have any issues with loading the file (in case there was an error in editing the file and the format of the xml becomes invalid).
**Upgrades**
When it is time to upgrade to a newer version of VitaraCharts, you will need to make sure you make the same changes on the latest version of *visualizations.xml*
For reference the structure of the *visualizations.xml* file is documented here [MicroStrategy Visualization xml spec](https://www2.microstrategy.com/producthelp/Current/WebSDK/Content/topics/pagecontent/Visualizations_Configuration_File_XML_Structure.htm)
---
# Agent Instructions: Querying This Documentation
If you need additional information that is not directly available in this page, you can query the documentation dynamically by asking a question.
Perform an HTTP GET request on the current page URL with the `ask` query parameter:
```
GET https://docs.vitaracharts.com/faq/how-can-we-install-subset-of-charts.md?ask=
```
The question should be specific, self-contained, and written in natural language.
The response will contain a direct answer to the question and relevant excerpts and sources from the documentation.
Use this mechanism when the answer is not explicitly present in the current page, you need clarification or additional context, or you want to retrieve related documentation sections.