How to increase the series limit?
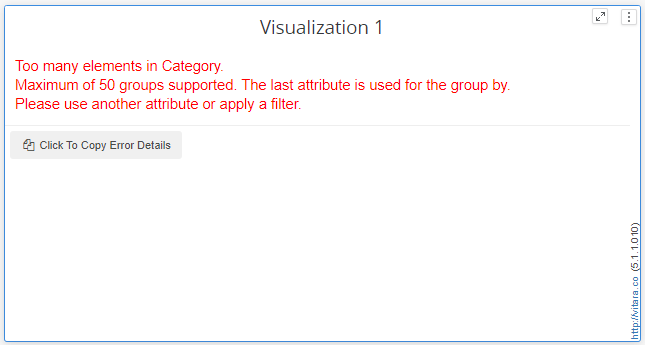
We are facing the data limitation error with groups in the Vitara Charts. How to fix it?
If we draw the chart’s series using an attribute, for example, an attribute in ‘Color by’ or ‘Break by’ drop zones, Vitara charts will draw the series if the elements in the attribute are less than 50. If the elements of the attribute in the ‘Color by’ or ‘Break by’ drop zones are more than 50, then Visualization will display a warning message “Too many elements”.

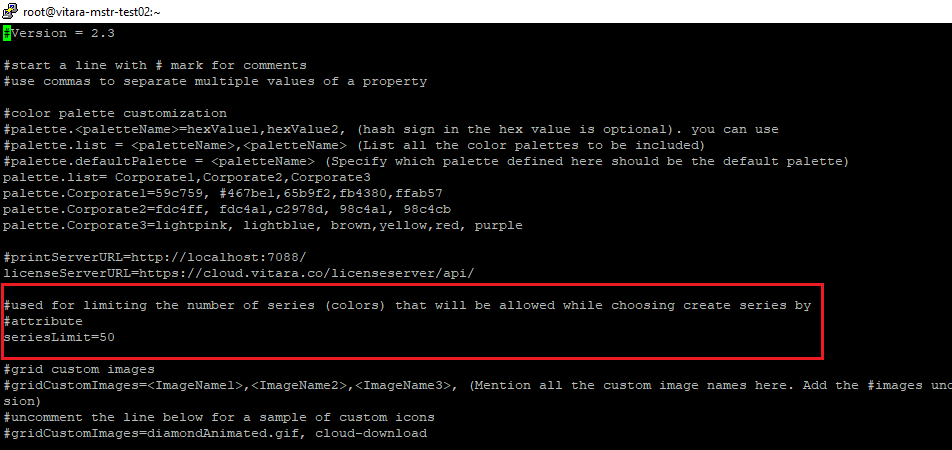
However, we can increase the series limit by modifying the global.txt file. The location of global.txt file is: webapps/MicroStrategy/plugins/VitaraCharts/custom/

Default number given is 50. Increase this number to a number greater than the elements in the attribute in the ‘Color By’ or ‘Break By’ drop zone.
IMPORTANT: After updating the global.txt file, clear the browser cache and reload the dossier/document.
Also, please note that the limit is enforced to avoid rendering performance issues. The more the number of groups that need to be rendered the longer the chart would take.
Last updated
Was this helpful?
